Timing of Interference
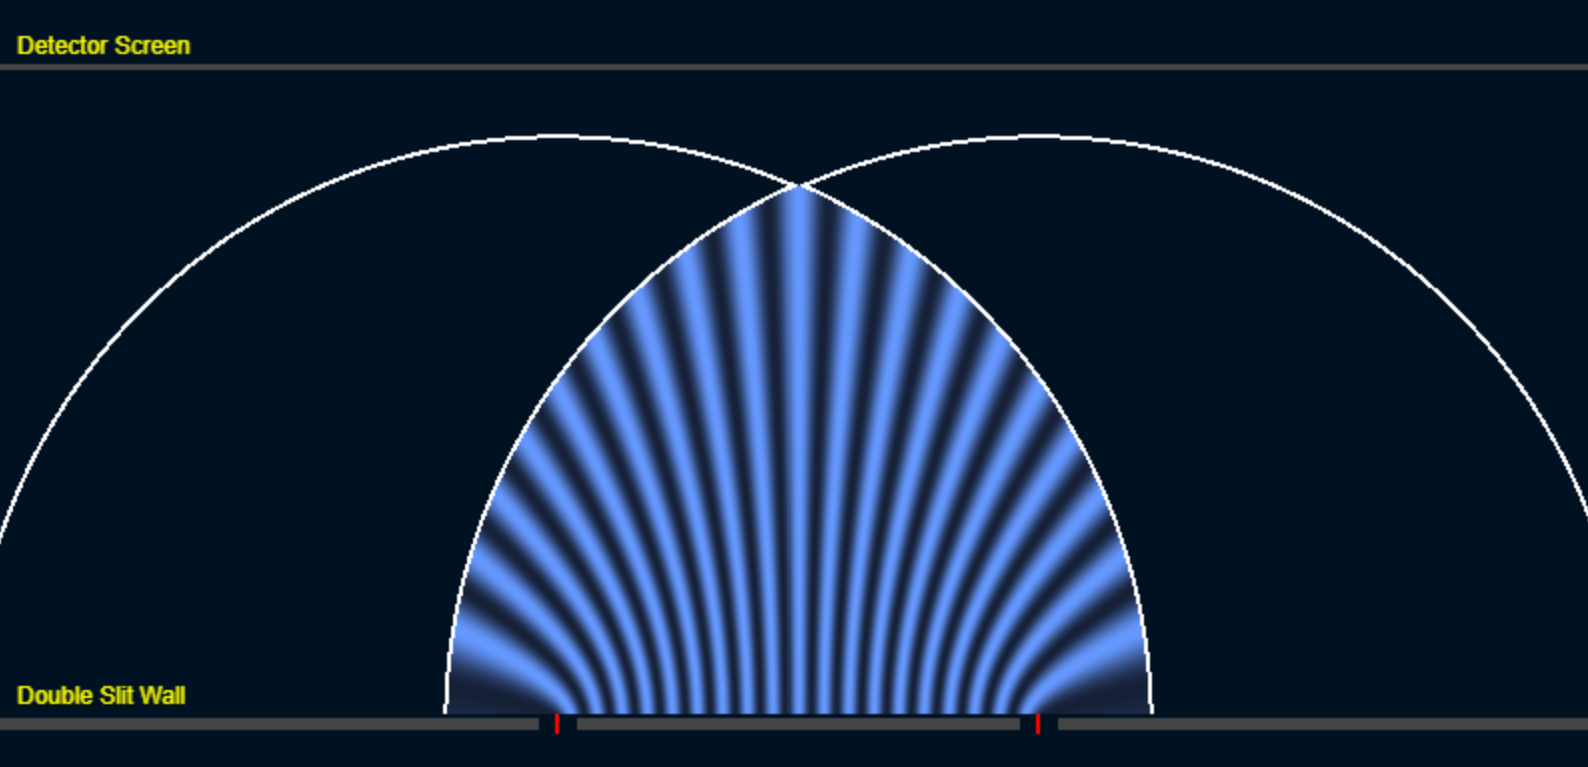
This demo shows a single particle traveling through two slits as two healing fronts that wash over one another. Each front expands outward from its slit as a hemispherical pulse. As they overlap, the combined phase begins forming an interference pattern, but only after both fronts have crossed the region in front of the detector.
Watch closely as the wavefronts first reach the detector: the screen lights up before the interference pattern appears. The centerline experiences constructive interference first, since both hemispheres meet there with nearly identical phase. The side regions take longer, because the path differences require several phase cycles before alignment occurs.
The key observation is that interference takes time. It does not exist the instant the wavefronts touch the detector. Instead, commits (Ledger events) are delayed while the two fronts exchange phase information. The interference pattern “spreads sideways” as those commits resolve over time, revealing that interference is a temporal process of reconciliation, not a static overlap.
In CBF terms, each bright fringe marks a region where the Event Ledger has found stable phase agreement between the two histories. The dark regions are zones of ongoing negotiation, still waiting for a consistent commit. This is what gives interference its unfolding, time-delayed character.