Planck Spectrum from Queue Buffering
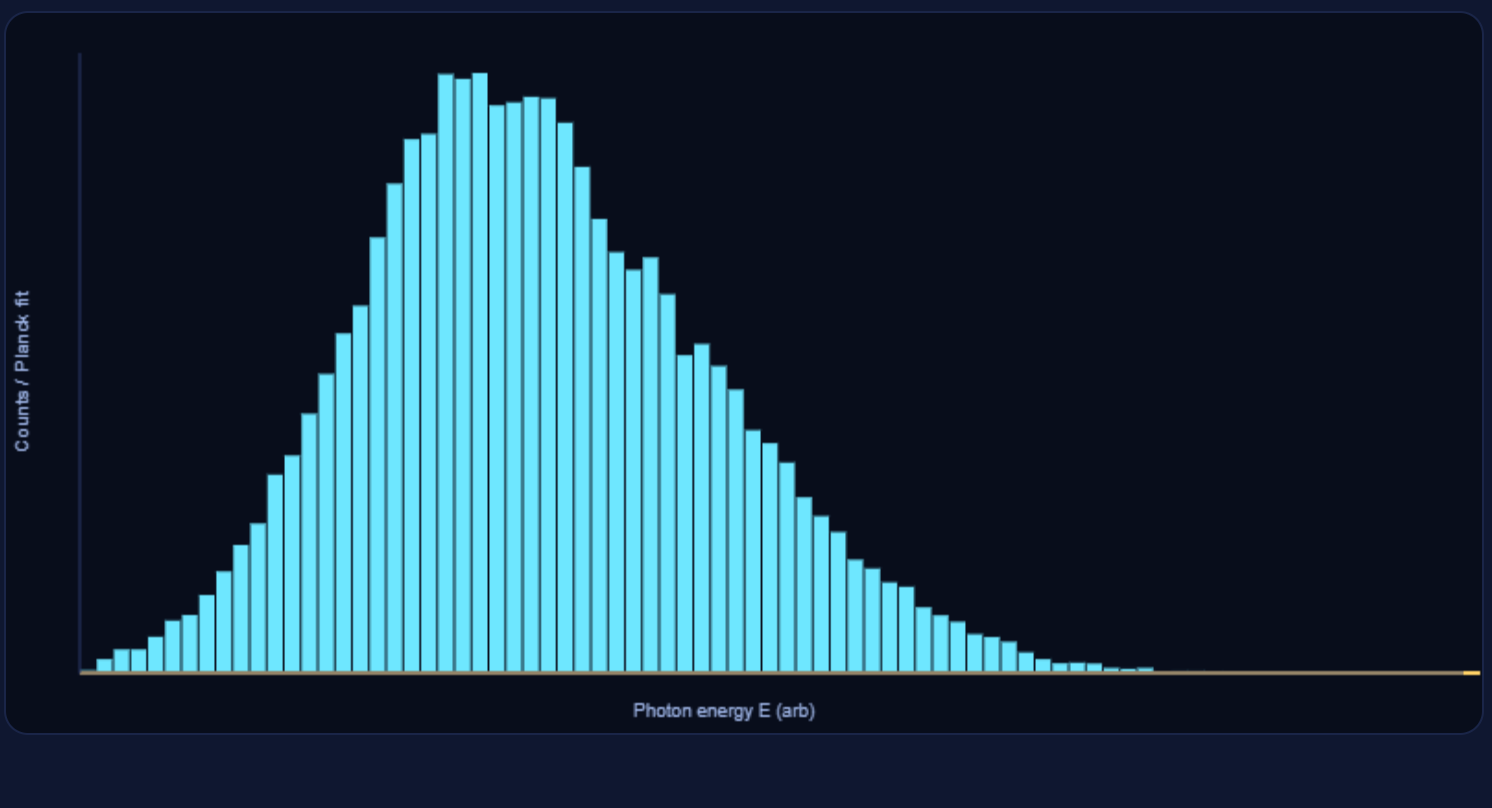
This toy demo models many atoms as energy queues fed by input power and drained by maintenance. When a queue overflows a threshold, it emits photons with E = h f. We histogram the emitted photon energies and overlay a fitted Planck curve built from the emergent mean photon energy. The right panel shows per-atom queues, including the overflow line.
How this maps to CBF
Each atom runs the per-tick budget C = T + M. Here, M is the maintenance drain (local keep-alive),
and what remains of T feeds the atom’s queue (E). When E exceeds the overflow threshold,
the system proposes emissions that pull quanta of size Eγ = h f out of the queue.
The emission attempt uses a Bose–Einstein acceptance factor (a proxy for temporal gate statistics), so higher frequencies are rarer at a given temperature. This is the queue-buffering analogue of blackbody radiation: many queues, fed and drained, occasionally synchronize and commit quanta. The Planck overlay is fit from the emergent average photon energy, not hard-coded from a temperature dial.
- C = T + M: maintenance drain lowers the available translation budget feeding queues.
- Queue buffering: emissions occur only when the queue has surplus above threshold, creating bursty commits.
- Beat-matching intuition: the BE acceptance plays the role of “how often phases line up” for a given frequency band.
What to expect
- As you raise input power
Ror lower maintenanceM, the mean queue fill rises, the fitted temperature increases, and the spectrum shifts to higher energies. - Higher overflow threshold
Ethsuppresses low-energy dribble, producing more separated bursts and a slightly harder spectrum. - With Microbursts on, emissions cluster, which shows up as transient narrow bumps that wash out statistically over time.
- The yellow Planck overlay tracks the histogram when enough samples accumulate; the fitted
Tderives from meanEγviaĒ ≈ 2.70 kT.
Settings
| Control | Default | Effect |
|---|---|---|
| Atoms (N) | 100 | Number of queues (independent emitters). |
| Input power R | 3.0 | Average energy in per dt, raises queue fill. |
| Maintenance M | 2.0 | Per-tick drain, the M in C=T+M. |
| Overflow threshold Eth | 2.0 | Minimum surplus required to emit photons. |
| dt | 0.05 | Tick size; affects stability and burst cadence. |
| Steps/frame | 400 | Simulation work per animation frame. |
| Emax scale (×kT) | 8 | Histogram x-range = EMAX_KT · kT. |
| Microbursts | off | Allows tighter multi-photon emission clusters. |
Key Code
Each atom is a queue with energy E. We add input R, subtract maintenance M (the M in C=T+M), then, if
E is above Eth, we attempt emissions that remove quanta Eγ=h f while keeping E ≥ Eth.
Budget law: a.E += (R - M)·dt is the direct implementation of C=T+M: maintenance lowers what can accumulate in the queue.
Queue buffering: commits only happen when surplus exists above Eth, producing realistic burstiness.
We draw trial frequencies with a simple f³ envelope and accept them with the Bose–Einstein factor
1/(e^{hf/kT}-1). This stands in for the Event Ledger’s temporal statistics: high-f commits are rarer at a fixed T.
Beat-matching intuition: acceptance is higher where the system more often finds temporal alignment for that band, which mirrors why low-frequency modes are more populated at a given T.
We estimate T from the recent mean photon energy using Ē ≈ 2.70 kT, then draw the
Planck curve on top of the histogram using the same x-range logic as the bars. No temperature knob is read here,
it is inferred from emission statistics.
Emergent temperature: thermal statistics arise from many buffered queues committing quanta. The fitted temperature is a summary of those commits, not an input.