Single-Slit, CBF Style
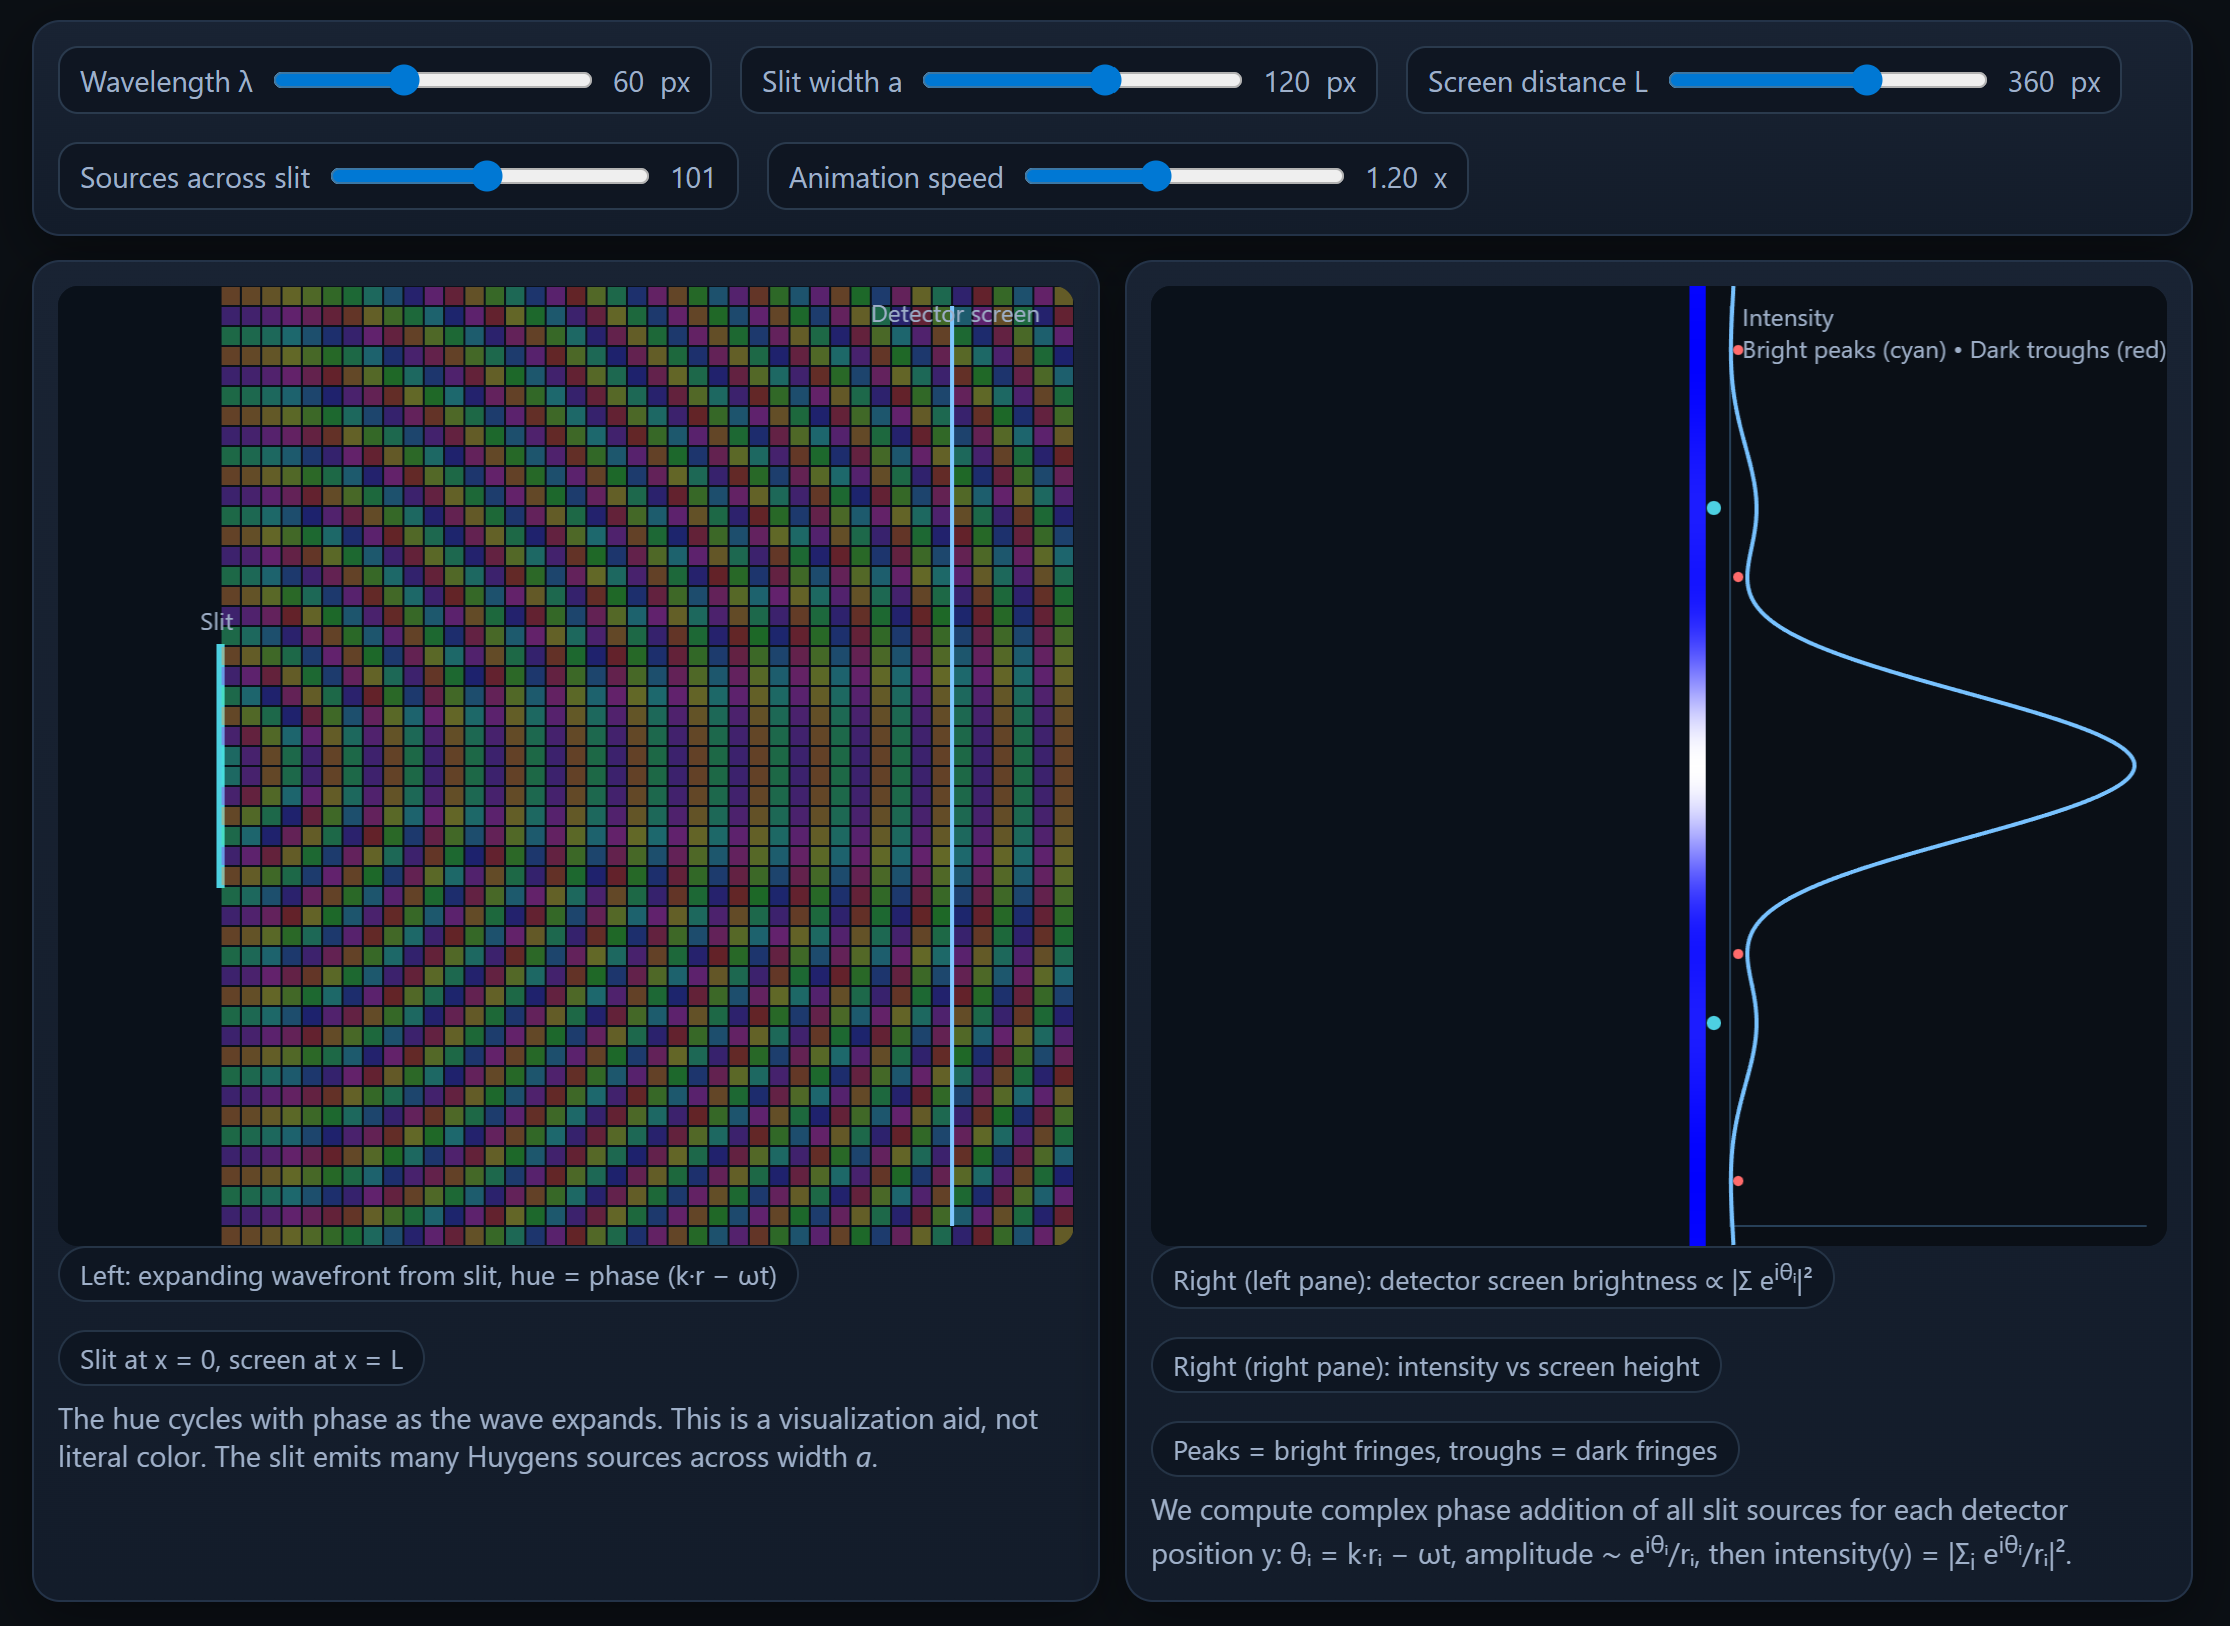
One expanding wavefront passes through a finite slit. The slit is modeled by many Huygens sources across its width. On the screen, brightness follows phase addition, intensity(y) ∝ |Σ eiθᵢ/rᵢ|², which produces the single-slit envelope with fringes.
Left pane: expanding phase field and geometry. Right pane: detector strip and intensity plot with peaks and troughs.
How this maps to CBF
In CBF, wave cells exiting the slit create healing hemispheres. The slit face seeds many local emitters, which diversify directions. The real simulation would let the field heal around edges and geometry. This demo reproduces the effect without the full healing engine. It streams photons, so you see many wavefronts in sequence. As each wavefront moves forward its phase advances, and the screen records a running history color coded by phase. The detector brightness is computed by phase addition across all sources at each screen point, which stands in for the Event Ledger selecting commits where phases align.
What to expect on the screen
Watch the wavefront as it hits the detector. The color along the wall is not uniform at the same time. When the center arrives it has one phase color. Toward the top and bottom edges the phase shifts faster, so those edges change color multiple times before the bulk of the wave reaches them. This produces bright and dark bands along the screen. The pattern is interference due to diffraction healing at the slit, summarized by the single-slit envelope with internal fringes.
Settings
| Parameter | Default | Notes |
|---|---|---|
| Wavelength λ | 60 px | Controls phase speed and fringe scale, k = 2π/λ. |
| Slit width a | 120 px | Wider slit narrows the central lobe, classic single-slit envelope. |
| Screen distance L | 360 px | Farther screen sharpens spacing and contrast. |
| Sources across slit | 101 | Huygens points along the slit. Higher values give smoother patterns. |
| Animation speed | 1.20× | Visual phase evolution rate, cosmetic only. |
Key Code
This function computes the screen brightness by summing phasors from every Huygens source across the slit. It focuses only on what matters for CBF, the phase comparison at the detector, not pre-screen energy mixing. The 1/r factor is a simple transport term that keeps path-length effects visible and lets the UI parameters (λ, a, L, N) map directly to what the Event Ledger would see when deciding which commits to accept.
By returning |Σ e^{iθ}/r|² per screen row, the code exposes the statistics of commit frequency,
creating bright bands where phase alignment is common and dark bands where alignment is rare. This minimal
implementation keeps the mechanism legible, so you can tie envelope changes and fringe spacing back to the
underlying geometry and wavelength without extra solver layers.
Temporal gate at the detector: The complex sum and squared magnitude represent the Event Ledger’s phase beat-matching at each screen point and time. No pre-screen “overlap,” only commit eligibility when phases align locally.
Commit frequency (Born-like): |Σ e^{iθ}/r|² is the statistical rate that the Ledger would accept commits there, producing bright and dark bands as observed outcomes.
This visualization sets the geometry and phase evolution that the detector logic consumes. It places the slit, distributes Huygens sources along its width, and renders the advancing phase as a hue-coded field. The goal is to make the incoming “information” to the Ledger transparent, so changes to λ, a, or L visibly reshape the phase map and therefore the detector’s commit statistics.
In full CBF, slit edges seed healing hemispheres around the aperture. Here we emulate that with many evenly spaced emitters without running the full healing solver. The result preserves the essential direction diversification and path-length differences that drive the detector interference, while keeping the rendering simple enough to track cause and effect by eye.
Healing hemispheres from slit edges: The evenly spaced Huygens ticks are the stand-in for edge-seeded healing in CBF, producing direction diversification without invoking the full solver.
Phase as the moving “history”: Hue shows instantaneous phase so you can connect what propagates to what the Ledger will later accept at the screen. You do not “see” waves in CBF, you see where commits accumulate.
Illustrations


